DiveWire product launch
Developed a performance report to provide customers with key audience reach metrics, addressing concerns about visibility. Increased repeat purchases and customer retention, leading to a 64% boost in revenue.
Client
Industry Dive
Industry
Business Media
Service
Product Design
UX Research
Duration
3 months

In 2021 Industry Dive launched Divewire, a press release distribution service. It was created to provide customers with an affordable option that allows for instant distribution to Industry Dive's audience of 14M readers. For $249, you can create a targeted campaign and share your news on any number of Industry Dive’s 29+ publications. Divewire ensures audience visibility by promoting company announcements in several locations across Industry Dive's publications:
Listed in the press release feed
Featured in the Dive publication’s daily newsletter
Displayed in the website sidebar and article footer for 21 days
Optimized for and indexed by major search engines
The challenge
Within the first two quarters, feedback from paying customers exposed a critical gap: no post-launch analytics. Communications teams had no evidence that their news actually reached the intended audience, hampering their ability to prove ROI to leadership. The absence of performance data directly correlated with a drop in repeat purchases and stalled net-new conversions, threatening the product’s revenue trajectory.
The solution
As the lead (and sole) Product Designer on DiveWire, I championed a data-driven reporting layer that would surface the metrics customers cared about most—impressions, clicks, click-through rate, top referrers, and publication-level reach—within 24 hours of release. My approach:
Mapped stakeholder goals to KPIs to ensure the report drove both client value and internal revenue objectives.
Conducted rapid discovery interviews with PR managers and CMOs to validate which metrics signaled success.
Designed a responsive, modular report that scaled from email snapshots to an in-app analytics view, enabling at-a-glance insight or deep dives.
Collaborated cross-functionally with data engineering to instrument new tracking events and with product marketing to craft an adoption campaign.
The performance report relaunched DiveWire from a simple distribution tool into an end-to-end campaign platform—turning one-off buyers into repeat, subscription-based customers and positioning Industry Dive for sustained growth.
The design process
Stakeholder Interviews & Technical Discovery
1. Sales Team—Customer Perspective
I began with focused conversations with DiveWire’s senior account executives to learn exactly which metrics clients request most often. Three themes emerged:
Verified exposure over raw distribution. Communicators want evidence of how many relevant professionals actually viewed their release.
Engagement metrics first. Page views and on-site impressions outweigh secondary indicators such as social shares.
Critical first-week window. Nearly three-quarters of total engagement occurs within the first seven days, making early performance data essential for proving ROI.
2. Engineering—Data & Feasibility
Next, I reviewed our event schema with the data engineering lead to determine what could be surfaced immediately and where additional instrumentation was required. Readily available data included:
Daily newsletter subscriber counts
Monthly site unique-visitor totals
Confirmed newsletter opens (pixel-based)
Identified gaps: press-release–level page views and a reliable aggregate audience-reach metric across all publications. We outlined a lightweight event-tracking plan and a new Snowflake view to capture these figures, establishing a clear path to a robust, client-facing performance report.
Phase | What I Did | Why It Mattered |
|---|---|---|
Discovery & Hypothesis | • Audited the data already captured (newsletter list size, confirmed opens) • Compared two delivery models—one-off email vs. live landing page—and hypothesised that customers needed rolling visibility, not a static PDF. | Set the product vision: an always-on report that could grow with the dataset and keep clients engaged past launch day. |
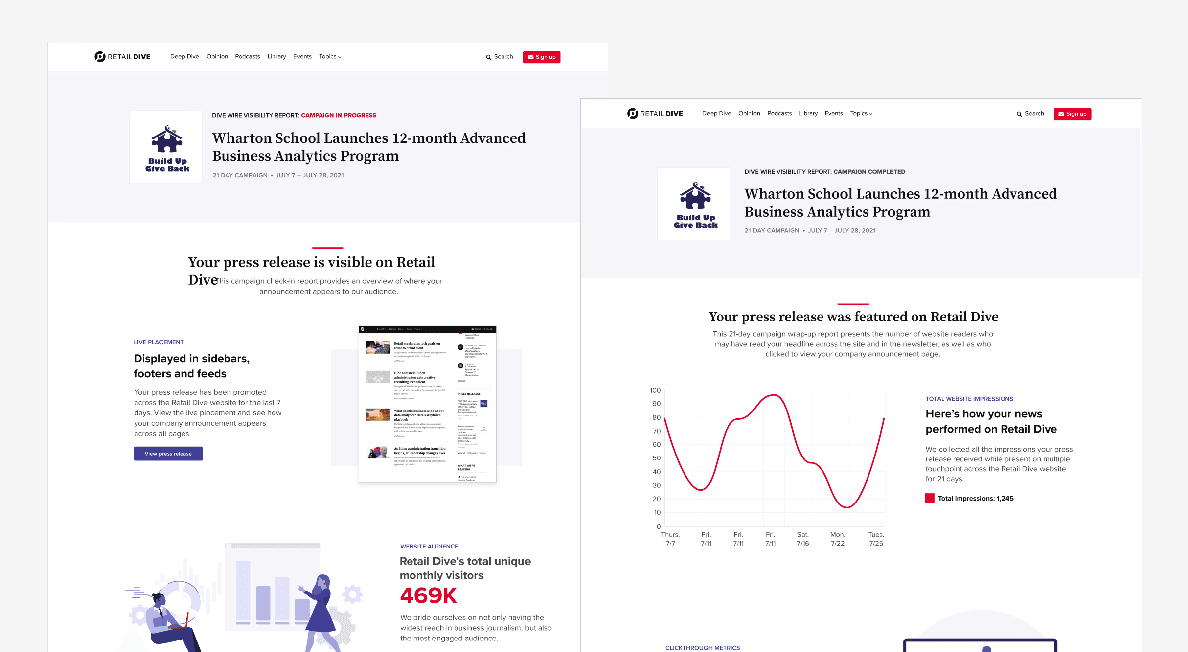
Iteration 1 · 7-Day “Visibility” Report | • Shipped a lightweight, infographic-style dashboard that updated daily for the first week of the campaign.• Exposed the single KPI customers valued most: impressions across site and newsletter placements. | Earned initial trust, drove a spike in repeat bookings, and gave us eight months of real-world usage data to mine for the next release. |
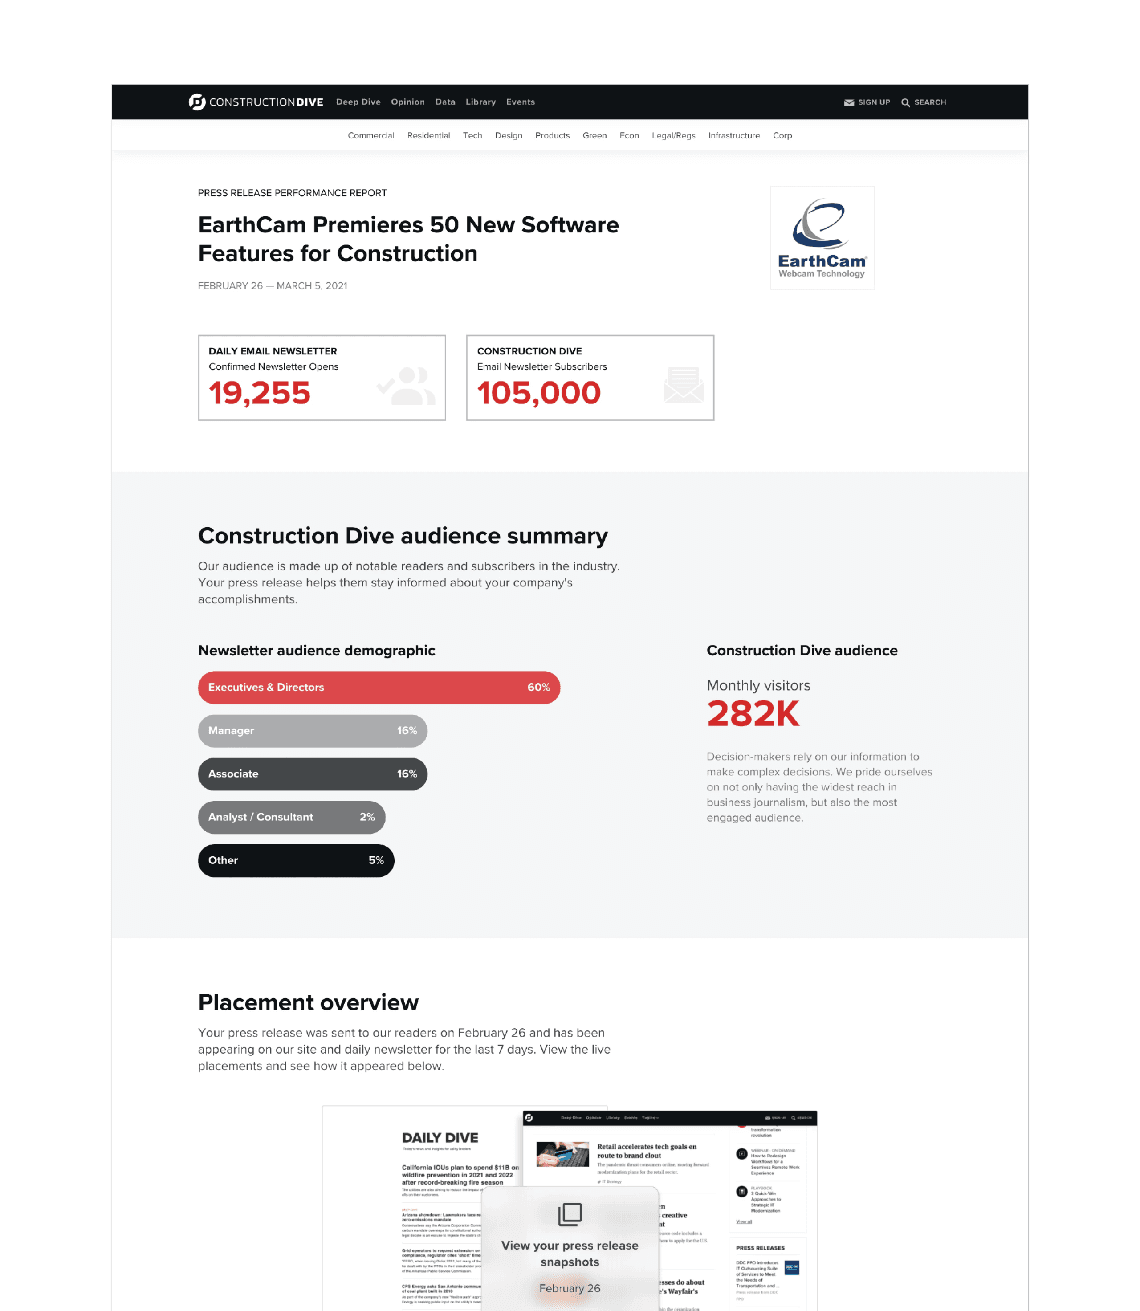
Iteration 2 · Brand Refresh & Deeper Metrics | • Leveraged Industry Dive’s new design system for a professional facelift (colors, typography).• Instrumented page-view tracking and built an aggregate Total Reach metric.• Re-architected content into clear, scannable blocks—Intro highlights, Audience Summary, Live Placements, Best-Practice tips, and a contextual upsell. | Turned a static status email into a story: where the release travelled, who engaged, and what to do next. Clients began citing the report in budget justification decks. |
Iteration 3 · 21-Day Wrap-Up | • Added an end-of-campaign report that automatically summarises the full 21-day run.• Swapped the “Live Placement” module for strategic PR next-steps and labelled the report “Campaign Complete” to signal closure. | Closed the analytics loop and positioned DiveWire as a full-cycle solution—from launch to ROI proof—strengthening the renewal narrative for Sales. |
the results
Over the course of a year, I led the end-to-end design of DiveWire’s Visibility Reporting suite—transforming a basic release tool into a data-driven platform that wins and retains business. By architecting a modular analytics framework, I not only met existing clients’ demand for proof of reach but also equipped Sales with the performance evidence they need to convert new prospects. Every DiveWire order now ships with automated 7-day and 21-day reports, turning analytics into an always-on product feature rather than a one-off deliverable.
Business impact
64% sales growth
$475K incremental revenue from repeat purchases
$108K in first-time, self-serve package revenue
70 % reduction in customer-service inquiries