DiveWire Visibility Report

Created a Visibility Report that proves DiveWire performance with clear audience reach metrics. Shipped a static v1, then scaled to dynamic 7-day and 21-day reporting as data became available—driving repeat purchases and contributing to revenue growth.

Client

Industry Dive

Services

Product Design

UX Strategy

Data Visualization

Duration

12 weeks - Incremental delivery across multiple releases

At a glance

Problem: DiveWire customers lacked clear proof of visibility after publishing, which created uncertainty about value and weakened repeat purchase confidence.

Role: Led product design for the Visibility Report (UX strategy, information design, reporting model, and cross-team alignment).

Solution: A Visibility Report that surfaces key audience reach metrics in a simple, trust-building format—delivered in phases from static v1 to dynamic 7-day and 21-day reporting.

Validation: Iterated through customer feedback, stakeholder review, and performance signals as data infrastructure matured.

Impact: Reduced customer uncertainty by making results tangible and comparable across time windows—supporting retention and repeat purchase decisions.

Summary
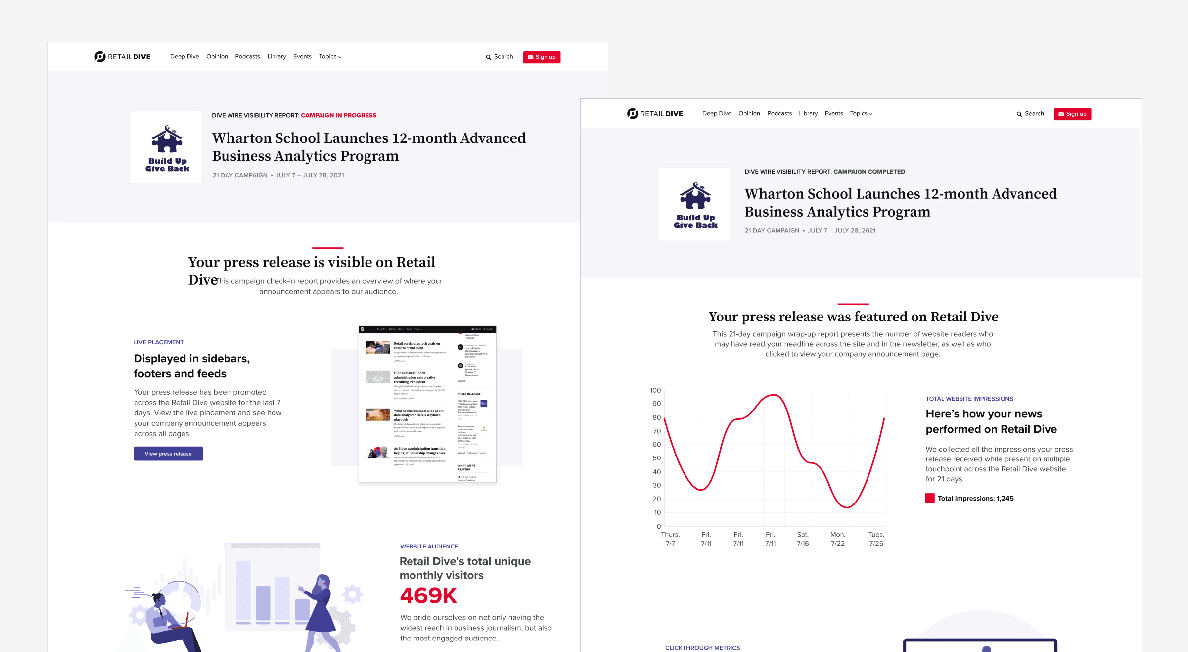
I created the DiveWire Visibility Report to answer the customer’s most important post-purchase question: “Did anyone actually see my release?” Because dynamic performance data didn’t exist initially, I shipped a static version first, then evolved the report into a dynamic experience as data became available—scaling it into 7-day and 21-day reporting views that made outcomes easier to trust and act on.

Top Metrics

• Audience reach visibility: reporting designed to represent distribution across Industry Dive’s ecosystem (14M readers, 29+ publications)

• Reporting scaled from static v1 → dynamic reporting → 7-day and 21-day views as data became available.

• Business outcome: improved confidence signals and supported repeat purchase behavior.

The Problem

Even when DiveWire delivered distribution, customers struggled to verify results. The experience left them asking:

  • Where did my announcement show up?

  • Did it reach the audience I paid for?

  • What impact did I get over time?

Two root issues drove the problem:

  1. Lack of performance proof: Customers didn’t have a clear, centralized way to view audience reach metrics tied to their release, creating uncertainty about value.

  2. No reporting foundation: The dynamic data required for real reporting wasn’t available initially, which meant a “fully baked” solution couldn’t ship on day one.

This uncertainty suppressed confidence and made repeat purchases harder to justify.

The Stakes

DiveWire is a paid product. If customers can’t clearly see results, they question the purchase—even if distribution occurred. The Visibility Report needed to:

  • strengthen post-purchase trust

  • reduce support burden driven by “where did it show?” questions

  • support retention and repeat purchase decisions by making value measurable

constraints & context

Missing data infrastructure: The reporting data required for dynamic metrics wasn’t available initially, so the first version had to be static and then evolve.
Trust + credibility: Metrics and framing needed to be simple, accurate, and defensible—no overpromising.
Multi-placement visibility: Releases appear across multiple placements, so reporting had to unify visibility into one coherent story.
Incremental delivery: Needed to ship a useful v1 fast, with a clear path to scale once data matured.
Time-window scaling: Reporting needed to support defined visibility windows, including 7-day and 21-day views.

Leadership & Contributions

• Created the Visibility Report experience end-to-end (UX strategy, information design, and reporting model)
• Defined what “visibility” should mean in reporting terms and translated that into a scannable structure customers could trust
• Shipped a static v1 quickly to provide immediate proof-of-performance while dynamic data was being developed
• Partnered with Product + Engineering to evolve the report as data became available
• Scaled the reporting experience into dynamic 7-day and 21-day views to match distribution windows and support customer decision-making
• Refined language and hierarchy to reduce uncertainty and strengthen confidence in outcomes

Validation & iterations

This wasn’t a redesign—I built a new reporting product to prove campaign value over time. Since the data foundation didn’t exist upfront, the solution had to be delivered incrementally: launch a credible first version quickly, instrument what mattered, then expand the report as real usage and tracking came online. The phases below outline how the report evolved from a 7-day MVP to a full 21-day campaign story.


Phase

What I Did

Why It Mattered

Discovery & Hypothesis

Audited existing signals (newsletter list size, confirmed opens) and mapped what data we could reliably report.

Evaluated delivery models (one-off email vs live report) and aligned on an always-on visibility report (not a static PDF).
Why it mattered: Set the product direction early: a report that could grow with the dataset and keep clients engaged beyond launch day.

Iteration 1 · 7-Day “Visibility” Report

Shipped a lightweight dashboard that updated daily during the first week of the campaign.


Prioritized the KPI customers valued most: impressions across site + newsletter placements.
Why it mattered: Delivered immediate proof of value, built trust early, and created a baseline dataset for the next release.

Iteration 2 · Brand Refresh & Deeper Metrics

Applied the design system for a cleaner, more credible presentation (type, color, hierarchy).


Added tracking + rolled up performance into Total Reach, then reorganized content into scannable modules (Highlights, Audience, Placements, Best Practices, Next Steps).
Why it mattered: Turned reporting into a story clients could use to justify spend and plan follow-on campaigns.

Iteration 3 · 21-Day Wrap-Up

Added an end-of-campaign summary that captures the full 21-day run and signals completion.


Replaced “Live Placements” with recommended next actions and positioned the report as a close-the-loop deliverable.
Why it mattered: Completed the analytics loop and strengthened the renewal narrative—positioning DiveWire as a full-cycle solution.


constraints & context

Missing data infrastructure: The reporting data required for dynamic metrics wasn’t available initially, so the first version had to be static and then evolve.
Trust + credibility: Metrics and framing needed to be simple, accurate, and defensible—no overpromising.
Multi-placement visibility: Releases appear across multiple placements, so reporting had to unify visibility into one coherent story.
Incremental delivery: Needed to ship a useful v1 fast, with a clear path to scale once data matured.
Time-window scaling: Reporting needed to support defined visibility windows, including 7-day and 21-day views.

the impact

Over the course of a year, I led the end-to-end design of DiveWire’s Visibility Reporting suite—turning a basic press release distribution tool into a data-driven product that supports both retention and new customer conversion. I architected a modular reporting framework that translated campaign performance into client-ready proof of reach—impressions, placement views, and newsletter opens—then scaled it from an initial MVP to automated 7-day and 21-day reports that ship with every order. This made analytics an always-on product feature (not a one-off deliverable) and gave Sales a consistent performance narrative to sell and renew against.

Business impact

  • 64% sales growth

  • $475K incremental revenue from repeat purchases

  • $108K revenue from first-time, self-serve package purchases

  • 70% reduction in customer-service inquiries

Why it worked
The reports moved customers from “Did this run?” to “What reach did I earn—and what should I do next?”—increasing confidence, reducing support burden, and strengthening the renewal story with concrete performance evidence.

Key screens

The three DiveWire report iterations (static, dynamic-in-progress, dynamic-completed)

Project overview

Luxe Beauty, a luxury cosmetics brand, aimed to enhance its digital footprint to better reflect its premium products and sophisticated brand identity. The goal was to create a visually stunning, user-friendly website that would attract high-end customers and provide a seamless shopping experience.

Next Projects